The first-ever comprehensive study of how the human brain changes over a lifetime could one day help doctors to monitor and diagnose neurological conditions such as Alzheimer’s.
The study, led by researchers at the University of Cambridge and the University of Philadelphia, has produced a unique set of charts based on brain scans that range from those found in a 15-week-old foetus all the way up to a 100-year-old adult.
So far, the researchers have identified a number of developmental milestones, including a rapid growth burst that begins at around 17 weeks after conception, when the brain is around 10 per cent of its full size. This growth spurt then ends at around three years of age, when the brain has reached around 80 per cent of its full size.
They also found that the volume of grey matter, the part of the brain made up of neurons, peaks at around six years old before beginning to slowly decrease. White matter on the other hand, the tissue that sends messages between different areas of grey matter, was found to peak at around 29 years old and then decline after we reach 50 years old.
The project began when researchers Dr Richard Bethlehem, of the University of Cambridge, and Dr Jakob Seidlitz, of the University of Pennsylvania, met at a conference. It brings together data from almost 125,000 MRI brain scans taken from more than 100 separate studies worldwide.
“This is very much started as a grassroots initiative, essentially between just me and Jakob, at a conference a couple of years ago. We just said to each other wouldn't it be cool if we could pool all these different research studies together to create a reference point or an anchor point for any future work?” Bethlehem told BBC Science Focus.
“We basically started to reach out to people in our network and also started cold calling people that had published on specific datasets or specific periods of the lifespan to ask if they wanted to come on board.”
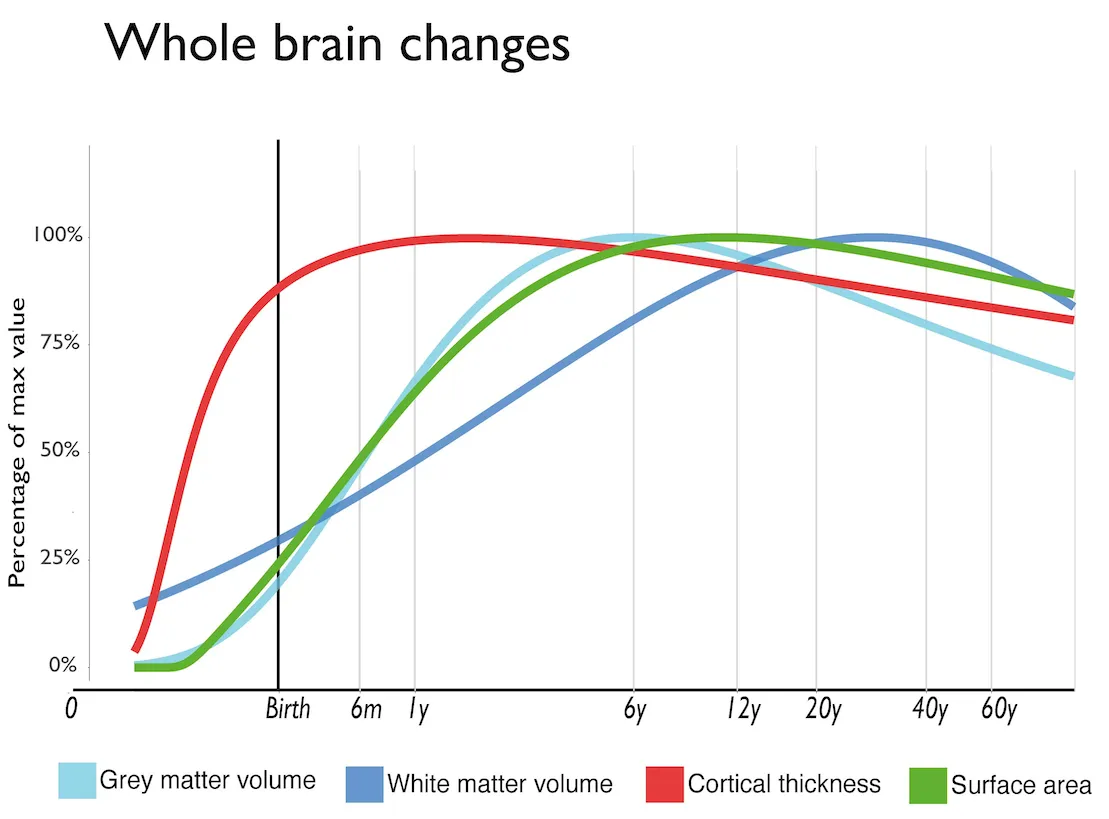
The team pieced together the charts by using imaging software to extract data such as the volume of grey and white matter or the thickness of the cortex – the brain’s outer covering - from their huge bank of MRI scans.
They estimate that the charts, which can be viewed on the open access site www. brainchart.io, took around 2 million hours of computing time to produce.
Although the charts are not currently ready for use in the clinic, the long-term aim of the project is to map out typical changes that occur in the brain as we age. This information could then be used much in the same way that growth charts mapping out height and weight are used to monitor the development of children.
Eventually, they could provide vital information on how the brain differs in neurological conditions such as Alzheimer's disease, which causes a loss of brain tissue.
“If you think about the situation as it exists, currently someone will have a brain scan because there's already suspicion that something might be off. And an expert like a radiologist or a neurologist will look at that scan and using all their expertise and knowledge and experience, say, yeah, we can clearly see there's something not quite right in this scan. But that's not a quantitative statement,” said Bethlehem.
“They can't say it looks atypical by this much relative to where you should be if you're this age or gender. Hopefully what this tool can provide in the future is something that's a little bit more quantitative. Something where you can say all this is extreme, but it's extreme by this much or it's changed by this much over time.”
The team now hope to expand the dataset to include more scans taken from under-represented socio-economic and ethnic groups as well as analysing the current data in finer detail.
“We just scratched the surface with this dataset in terms of defining the milestones in the paper,” said Seidlitz. “And so in the future, we really hope to hone in on more concrete developmental epochs that have been done in other domains, like in molecular biology and genetics and transcriptomics.”
Read more about the brain:
- Listening to music with personal meaning may help ease the symptoms of Alzheimer’s disease
- Brain food: The best foods to eat for better attention, memory and mental health
- A neuroscientist explains how your genes affect your mental health
- The 6 best habits to keep your brain fit, according to neuroscience