Great leaps forward in science often come from asking obvious questions and coming up with ingenious ways to answer them, and for astronomers –who can’t carry out experiments in the conventional sense since the vast majority of the Universe lies far beyond their reach – this is particularly true. They have to rely on finding new and innovative ways to harness the information already arriving at Earth in the form of light from distant celestial objects.
Take a brief glance at the stars, for instance, and three things immediately stand out: they’re scattered unevenly across the sky, vary hugely in brightness, and differ in colour from intense blues and whites to fiery reds.
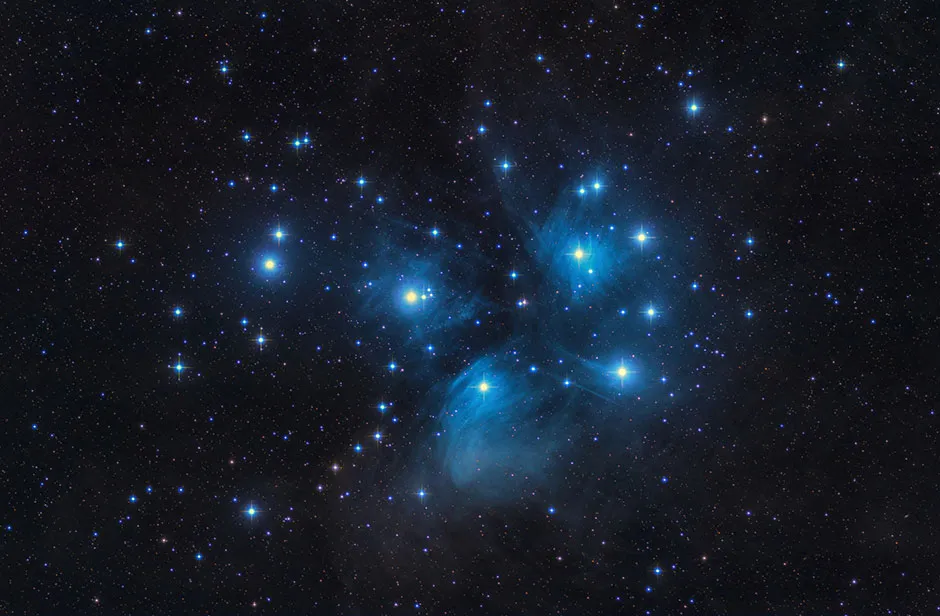
These properties are so obvious that they’re easy to overlook, but together they played a key role in the creation of what’s now called the Hertzsprung-Russell diagram – a deceptively simple chart that explains not only the physical properties of stars, but also reveals their past history and future evolution. The story begins with the Pleiades, the most famous star cluster in the sky.
The Pleiades mark the shoulders of the great charging bull constellation Taurus, and are an unmistakeable sight in the night sky throughout the months of northern winter. Around autumn and winter, look for them as a distinctive fishhook-shaped blob of light, climbing into eastern skies in the late evening.
Read more about stars:
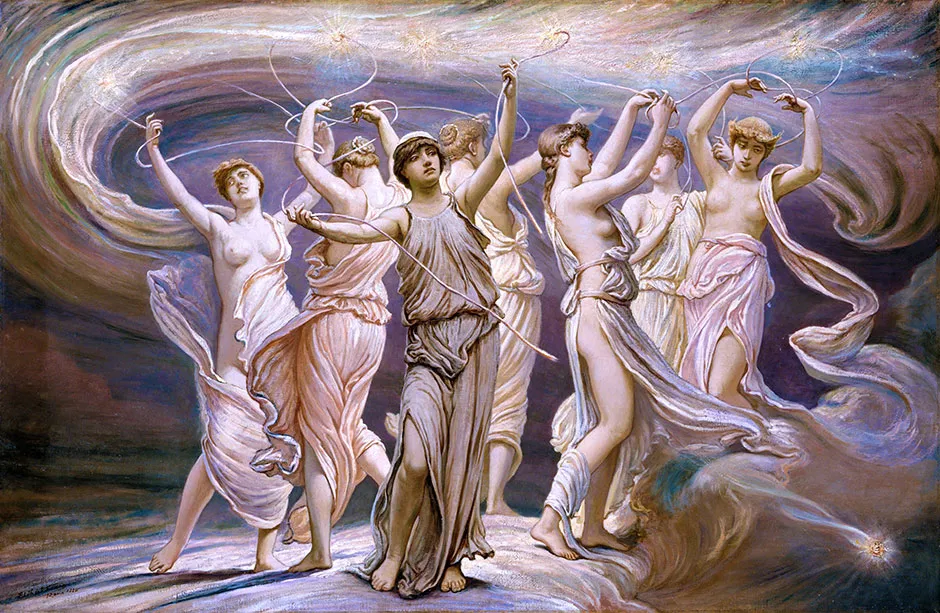
Despite being named after the Seven Sisters of ancient Greek mythology, it’s often said that only six stars are visible to the naked eye for people with average eyesight, but a few sharp-eyed stargazers have reported many more.
The Sisters were an obvious target for the first telescopes, and most people who took the time to think about it realised that such an alignment occurring by chance was very unlikely. In 1767, English clergyman and philosopher John Michell crunched the numbers and announced that the odds of a chance alignment were one in half a million.
Although it was impossible to estimate the true distance to the Pleiades (now thought to be around 450 light years) with the technology of the time, the fact the cluster was undeniably a physical group meant that member stars could be considered as having the same immense distance from Earth.
This meant that, for once, astronomers could stop worrying about how the varying distances of stars, and potentially differing amounts of light-absorbing dust between us and them, affected their brightness and colour as seen from Earth.

Instead, it was safe to assume that differences in the measured properties of cluster stars in the Pleiades were a direct reflection of differences in their true brightness and colour, affected by the same factors in every case. Around 1908, an ingenious young Dane called Ejnar Hertzsprung found a way of putting this to good use.
Hertzsprung had originally trained as a chemist but had lately returned to his boyhood passion for the stars. He also had a talent for lateral thinking and asking the right question at the right time.
In the early 1900s, for instance, he came up with a clever rule of thumb to estimate stellar distances, based on the idea that if all stars are drifting randomly through space at about the same speed, then relatively nearby ones should move across Earth’s skies more rapidly than their more distant cousins.
By combining his rough distance estimates with patterns in the spectra of stars (the rainbow-like bands produced when starlight is split up by wavelength and colour), he spotted features that allowed him to identify two broad stellar classes from their spectra alone. On the one hand were fairly average stars like the Sun, and on the other were rare stars that appeared brilliant even over great distances. Astronomers soon began to call these two classes “dwarfs” and “giants”.
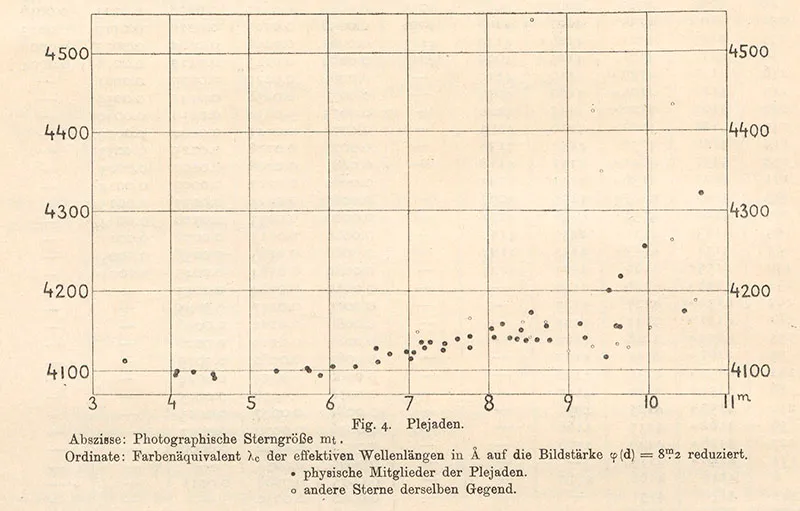
Searching for a way of comparing properties between large numbers of the more common dwarf stars, Hertzsprung zeroed in on the Pleiades. Using that handy assumption that all of its stars lie at the same distance, he devised a graph that compared the apparent brightness of individual stars with their spectral type (an indication of their colour and surface temperature).

Eventually published in 1911, the graph was limited in its scope because the stars of the Pleiades are heavily biased towards the blue end of the spectrum. But there was still enough variety to show a clear pattern; the most luminous stars were also the hottest, and as brightness dropped so did temperature.
Hertzsprung’s diagram was clearly hinting at something very important about the stars, and his mentor, respected German astronomer Karl Schwarzschild, was convinced it was a major discovery. But the astronomical establishment remained unconvinced – and that’s where Henry Norris Russell enters the story.
Russell, the son of a Presbyterian minister from New York State, had pursued his interest in the stars along a more straightforward academic route. A degree and PhD at Princeton were followed by research at Cambridge University around 1902–5, where he focussed on ways of determining the properties of binary stars (those which orbit around each other).
Binaries offered another way of finding and comparing the properties of stars at an identical distance from Earth, but Russell realised you could also use a binary’s orbit to find its true distance.
The principle was another example of lateral thinking: if you could find out enough about a binary system to calculate the true dimensions of its orbit, then you could compare that to the apparent size of its orbit in the sky and figure out how far away it was. The method only worked for a few stars, but it got Russell interested in the whole question of comparing stellar properties such as size, mass, spectral type and luminosity.

Freshly minted as a Princeton professor in 1911, he was therefore well placed to see the potential of Hertzsprung’s idea, but realised the need to extend it beyond the limited scope of the Pleiades. At this point, he got lucky– using new measurement techniques, other astronomers had just published a pair of independent estimates for the distance to another famous star cluster, the Hyades, both of which put it at around 135 light years from Earth.
The Hyades is a relatively large and loose cluster, a near neighbour to the Pleiades in our skies, representing the face of the bull Taurus. Useful for Russell, its stars are spread across a much broader range of colours. By combining estimates of their true brightness with his own binary measurements and the properties of a handful of nearby stars whose distance could be measured by other means, Russell was able to make a direct comparison between some 300 stars.
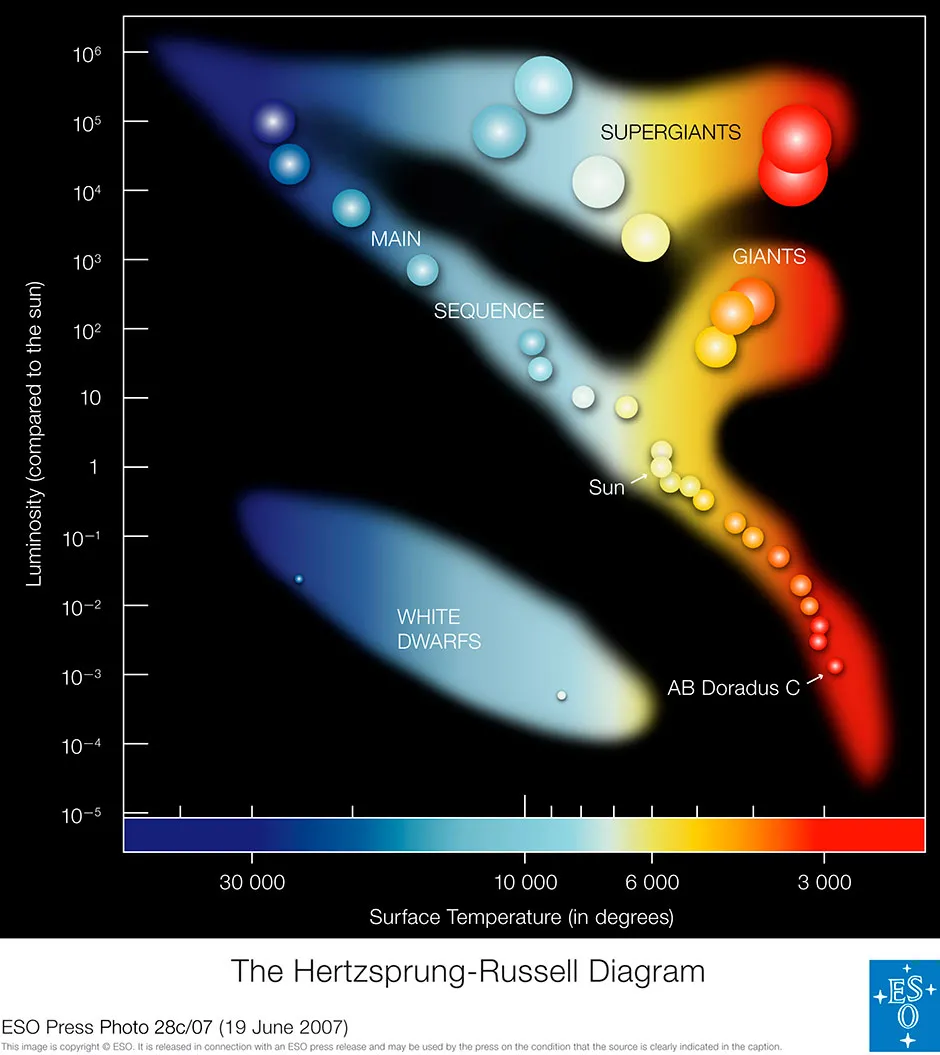
Russell’s version of the “H-R diagram”, unveiled in December 1913, set a template that has been followed ever since, measuring stellar brightness on the vertical scale, and spectral type on the horizontal.
The pattern hinted at in Hertzsprung’s early diagram suddenly became crystal clear: a vast majority of stars (the dwarfs) formed a diagonal strip linking luminous blue stars to faint red ones (a region that Hertzsprung had already named the “main sequence” on account of its dominance).

A handful of giants, meanwhile, ran horizontally across the top of the diagram in a broad band. The two groups came close together at the hot, blue end of the spectrum, but were widely separated at the cool, red end where stars were either extremely luminous or extremely faint.
By revealing for the first time the true distribution of stellar properties, the H-R diagram gave astronomy a whole new vocabulary, highlighting the existence of distinctive red dwarfs, red and orange giants and others. These were soon joined by white dwarfs (extremely hot but faint stars, now known to be the exposed, burnt-out cores of Sunlike stars) and even a range of ultra-rare multicoloured supergiants along the top of the diagram.
Read more about astronomy:
- Can life exist around a black hole?
- 8 beautiful Hubble Space Telescope images you probably haven’t seen before
Russell, meanwhile, noted that the relative numbers of stars on the diagram was inevitably biased towards those stars we can more easily see: giants shine out over many hundreds of light years, while dwarfs – especially orange and red ones – are all but invisible beyond our cosmic back yard.
The decades that followed Hertzsprung and Russell’s breakthrough would see major breakthroughs in our understanding of the structure of stars, culminating in the 1930s with the discovery of nuclear fusion as the power source in their cores.
Ultimately, our understanding of nuclear physics and stellar structure together would allow the diagram to be harnessed in new ways– not only as a map of present-day stellar properties, but also as a template across which the changing features of stars at different stages of their lives can be traced, from the past into the distant future.
A History of the Universe in 21 Stars (and 3 Imposters) by Giles Sparrow is out now (£12.99, Welbeck Publishing Group).
- Buy now from Amazon UK or Waterstones