Most of us have seen weather maps at some point in our lives – in geography lessons at school, or in weather forecasts. But what do all the lines, labels and shapes actually mean?
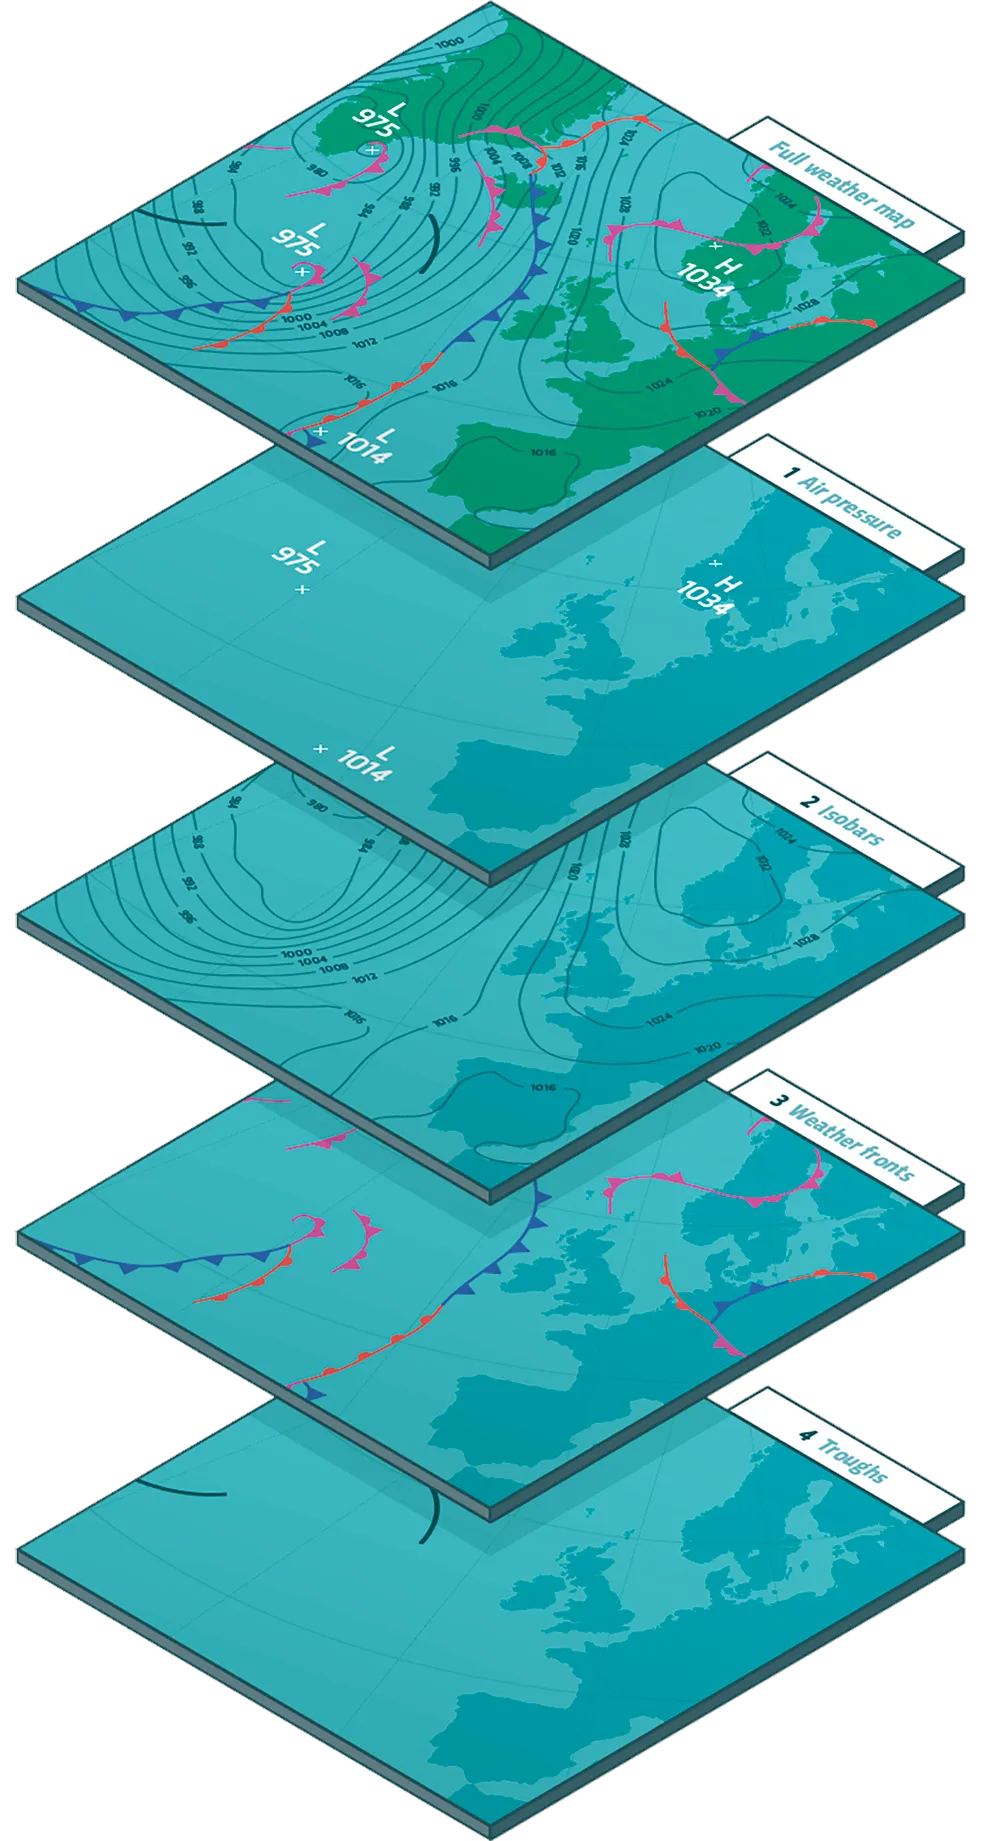
1. Air pressure
Areas of high and low air pressure are labelled on weather maps with the letters H and L.
High pressure generally brings calm, dry and settled weather, whereas low pressure typically means unsettled weather, with cloud, wind and rain.
2. Isobars
The continuous parallel lines with numbers on them are called isobars and connect areas with the same air pressure. The closer the isobars are together, the stronger the wind will be.
3. Weather fronts
These define the boundaries between different air masses, typically bringing cloud, precipitation and changes in temperature and humidity. They’re depicted through coloured lines with shapes on one side, with the side featuring the shapes showing the direction of movement.
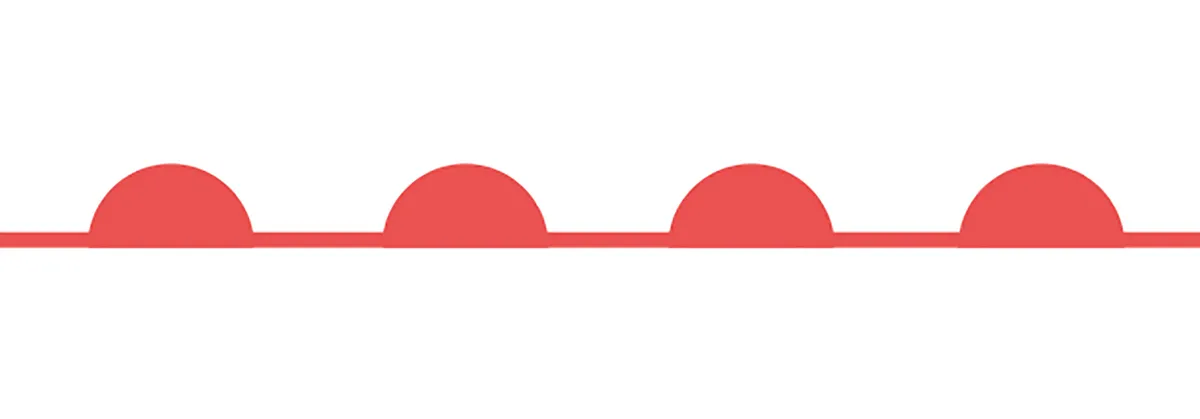
Warm fronts are shown through red lines featuring semi-circles, which resemble the rising sun. As a warm front passes through, it becomes warmer and more humid.
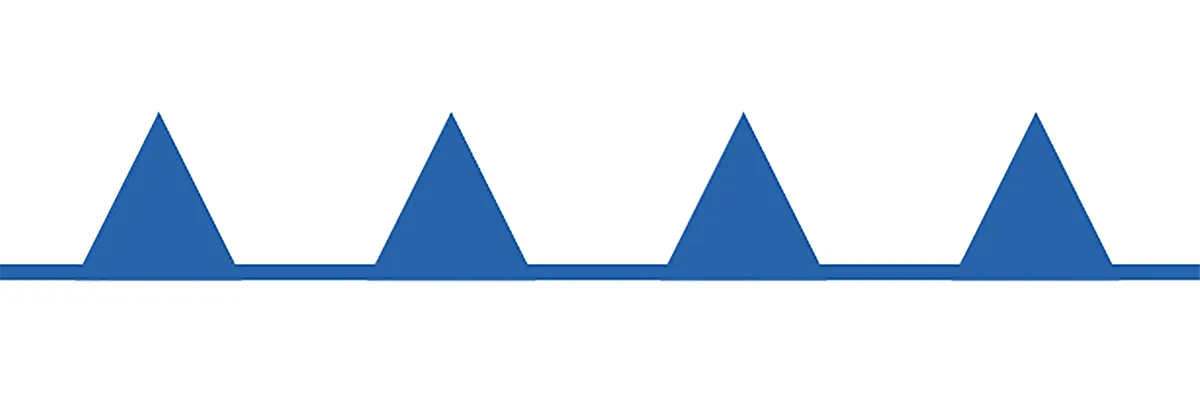
Cold fronts are shown through blue lines featuring arrows, which resemble icicles. As a cold front passes through, it becomes colder and drier.
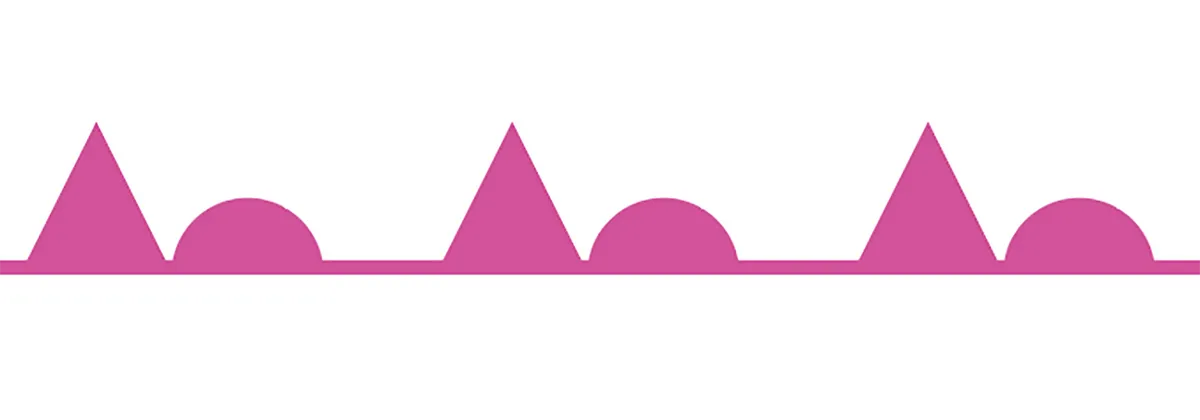
Cold fronts can move faster than warm fronts, so sometimes a cold front will catch up with a warm front and force the warm air aloft. This causes an occluded front, which can have features of both warm and cold fronts. They’re shown with purple lines featuring both arrows and semi-circles.
4. Troughs
A black line without any shapes on it is called a trough. This is used to show areas of turbulence and instability, and are often good indicators for rain.
Read more:
- Why do the British talk about the weather so much?
- Why do I have less of an appetite in hot weather?
- Can trees predict the weather?
- Quick Q&A: How hot would a pavement have to be in order to fry an egg on it?
SOURCES: ThoughtCo., The Met Office and The Royal Meteorological Society